
🌐 VIETROADIE WEEKEND EDITION
The AI Financing Question
WEEK ENDING FRIDAY, OCTOBER 16, 2026 · By David Nguyen, VietRoadie Technologies
Good evening, and welcome back to Weekend Edition.
I'm David Nguyen, and this is VietRoadie, where we keep a global perspective and stay grounded in the levels.
This week the market felt the bearish, recessionary pressure, and the setup could get worse before it gets better. The usual suspects are still in play: oil (CL / USO) and rates (TNX). But a new variable moved to the front of the line this week: can the AI buildout afford to pay for itself? The question is no longer just whether demand will be there, but whether the financing holds up. Let's get into it.
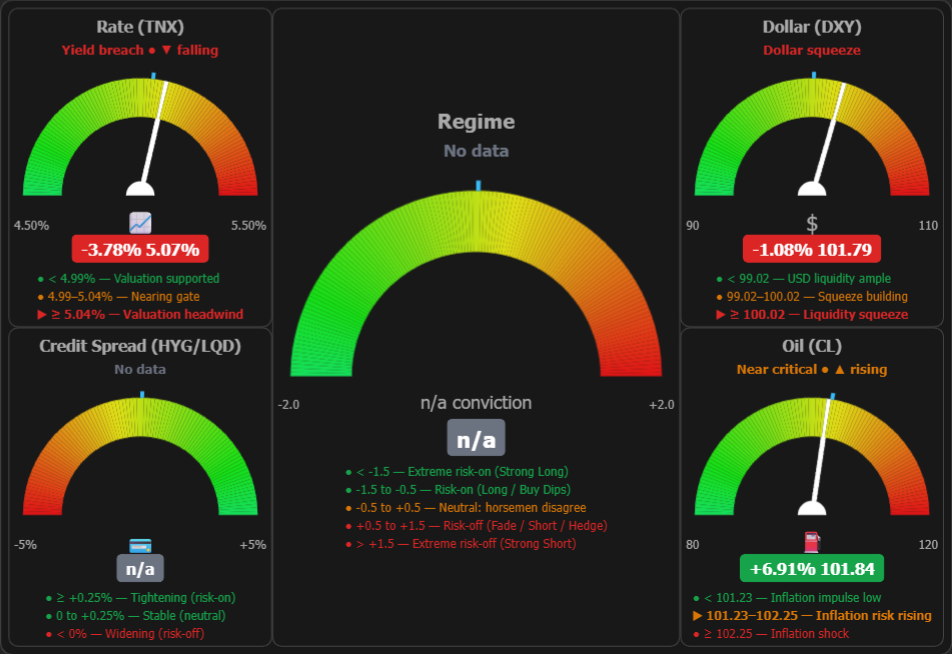
⏪ The Way Back Machine: Last Week in Review
- Monday: Bond market closed, quiet tape.
- Tuesday: Financial earnings season kicked off. Oil and yields pulled back slightly. We saw plenty of "pop and flop" (some traders call it "gap and crap"): financials (XLF) gapped up, then faded. Even so, the sector finished the week strong.
- Thursday: September CPI and Core CPI both came in hotter, and the market is hypersensitive to any inflation data right now. CoreWeave (CRWV) bond yields also climbed to 15% in under 48 hours. More on that below.
- Friday: PPI printed 1.5% against a prior 0.5%. Rates stay elevated and the market hated it.
What the screen told us
A lot of red. The Nasdaq 100 (NDX / QQQ) took the hardest hit, and XLK is now roughly 40% of the S&P 500 (SPX / SPY), so tech weakness drags the whole index. XLK was down more than 7% on the week.
Underneath, though, it was a tug-of-war. Money rotated rather than left:
- Financials (XLF) and Healthcare (XLV) recovered into the close
- Staples (XLP) rebounded about 5%, a classic rotation
- Energy (XLE) gained about 4% with crude
- Utilities (XLU), Materials (XLB), Real Estate (XLRE) held up as rates eased slightly
It isn't a fully bullish market, but the weight of mega-cap tech is so heavy that the headline index can still look okay while the internals churn.
Volatility woke up. The VIX jumped about 30%, from roughly 14 to 19. Think of it as the price of out-of-the-money SPX puts rising as buyers pay up for protection. It may be a signal, and it may not, but I wouldn't ignore it.
Other markets: Gold (GLD / GC) struggled. Crude (CL) sits near $98.94 with no resolution in Iran. Bitcoin (BTC) fell about 2.4%, still trading like a risk asset.
📉 The Charts: What's Really Happening
S&P 500 (SPX / SPY, daily)
The trend line from early August is still intact as of Friday's candle, but it feels risky. We retraced 100% of the move to new highs, and I'm wary of a breakdown. Bear triggered at 7,510.
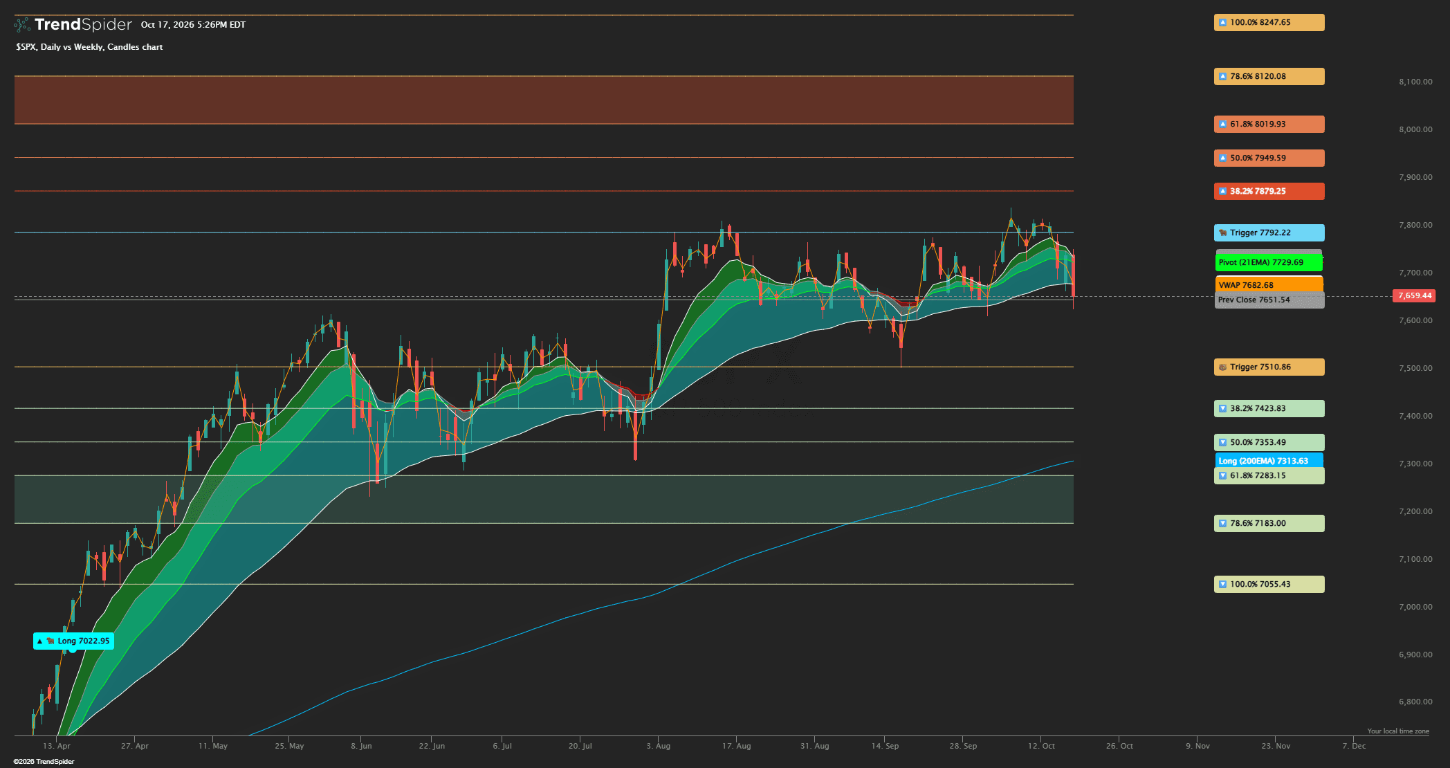
View the SPX chart on TrendSpider →
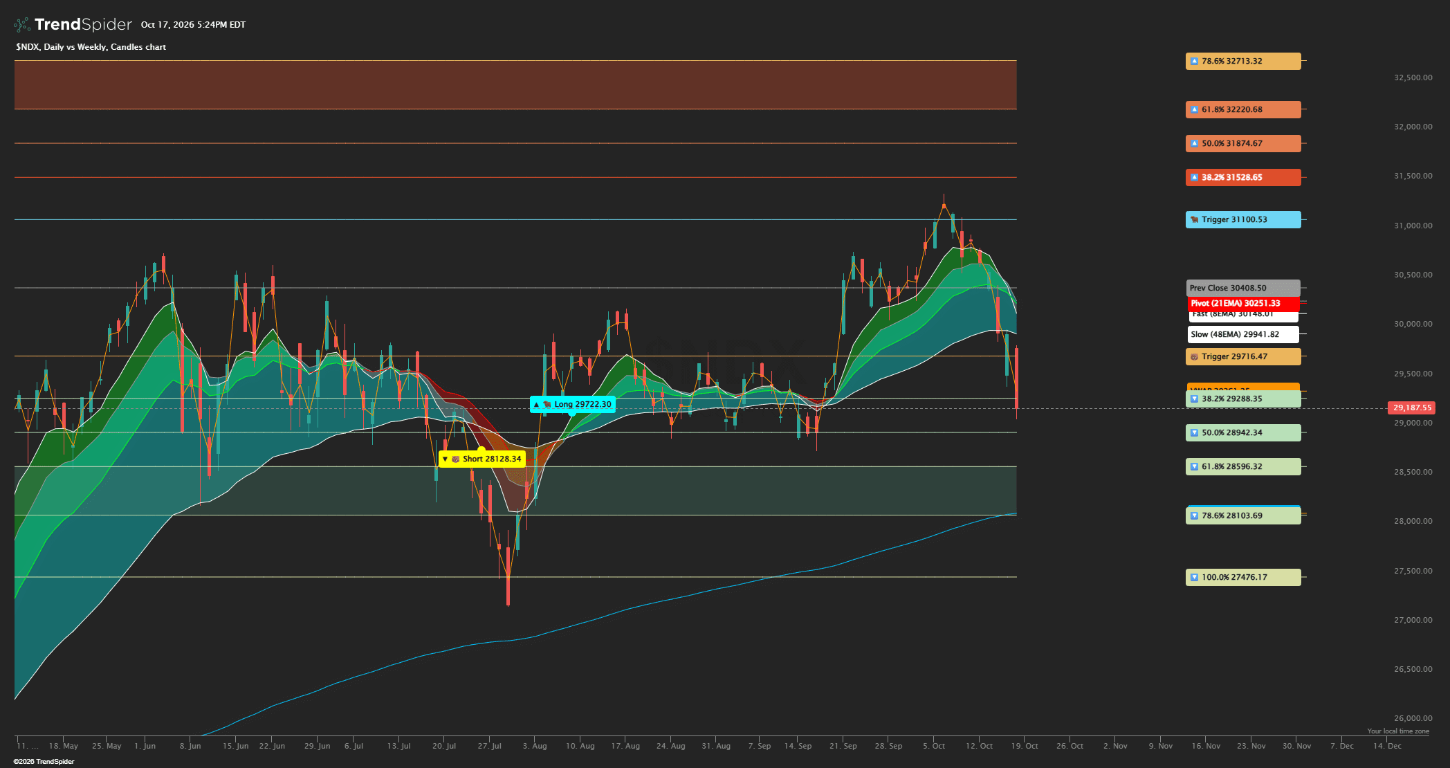
Nasdaq 100 (NDX / QQQ)
This one has already broken. We saw a 100% retracement break, a brief relief bounce Thursday (common in bear phases, where short covering comes every other day), then a fresh two-day low on Friday. Keep 28,500 on your radar for next week. That's the base of what I call a "fill the triangle" pattern: when the sloping edge breaks, price tends to travel down to fill the empty space toward the base. That's a pattern I've watched play out the large majority of the time. My bias is that NDX drifts toward 28,500 at minimum.
🧨 The Main Event: CoreWeave and the AI Financing Question
On October 13th, Chamath Palihapitiya (founder of Social Capital, CEO of AI firm 8090) posted on X that CoreWeave's (CRWV) bond yield had hit 15%. That's up from just under 10% at the start of the week, in a trend that had been building since about June–July.
Who is CoreWeave? A "neo-cloud" company. Where AWS (AMZN) and Azure (MSFT) sell general-purpose compute, storage, and bandwidth, neo-clouds exist almost solely to serve AI workloads. That means they're borrowing heavily to build infrastructure ahead of demand.
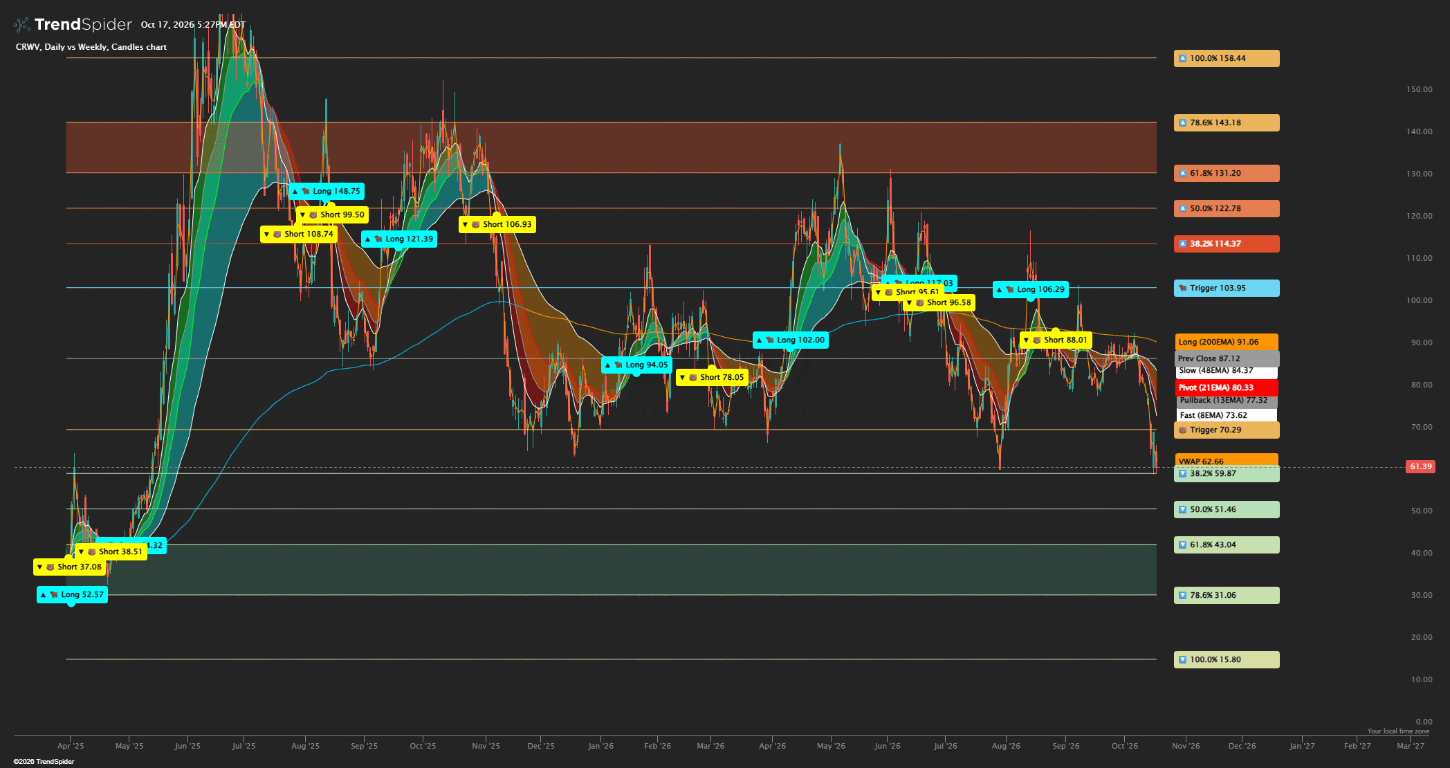
View the CRWV chart on TrendSpider →
Why a 15% yield matters
Bond holders are selling and demanding a big premium for the risk. That says the market is getting nervous about the whole industry.
The shift in the narrative
Before: "Will there be enough demand for AI?" (the overbuild fear)
Now: "Can these companies afford to build it?" (the financing fear)
This didn't come out of nowhere. Neo-clouds have been under pressure since early October, when conflicting reports on OpenAI's revenue run rate circulated: $50B vs. the expected $70B. One outlet's figure was walked back, but the damage was done. These names are viewed as the subprime of the AI trade.
Contagion watch
- Analyst Gil Luria called them "the subprime of AI"
- Oracle (ORCL) fell hard on its own debt load, so this is reaching established players
- Nvidia (NVDA) owns roughly 10% of CRWV
- The 10-year yield (TNX) above 5% makes financing painful
- Meta (META), Alphabet (GOOGL) and others are also borrowing against future AI demand
It's still oil and rates, but this could be the start of something bigger.
🔍 Technical Targets: Tech Under Pressure
- Crude Oil (CL / USO): Strong trend, bouncing off the trend line. Sitting near $100, a level the market has to respect. Normal conditions would put this closer to $60.
- 10-Year Yield (TNX): Dipped, but I don't see a trend change yet. Watch the 8 and 21 moving averages. A rollover would help the market. Otherwise it balances around 5% and then resumes higher.
- XLK: The triangle is clear on the chart, with a lot of open space beneath. Filling the triangle puts XLK near 180. I think the odds of a move toward that level are very high, and I'm stating that on the record.
- SMH (Semiconductors): The prior low is 503.63 and we closed near 539. It's at support, but how it got there matters. Price came down fast, in fewer days than the rally took, on widening range with big bars. That's emotional, high-momentum selling, and I generally don't buy supports reached that way. I expect a test of 503.63.
Everything's connected: SMH → XLK → NDX → SPX.
📅 The Week Ahead
- Monday: Quiet
- Tuesday: Housing Starts (high-impact). Earnings from GE, Netflix (NFLX), Intuitive Surgical (ISRG) and 3M (MMM).
- Wednesday: Tesla (TSLA) and Meta (META), both after the close. Also IBM and SAP.
- Thursday: Jobless claims/employment data, plus Spotify (SPOT), Procter & Gamble (PG) and Deckers Outdoor (DECK) (Ugg).
- Friday: American Express (AXP), a good stock to trade. Relatively pricey, with room to move.
Tech earnings are just beginning to stack up, and the calendar gets busier into late October and early November.
🧭 Bottom Line
- Technically, the market wants to move lower
- SPX retraced 100%, NDX broke down, and the triangle is filling
- Oil isn't helping, and rates (TNX) are stuck near 5%
The real question is whether the AI financing stress spreads. Is this the contagion that's been building since the OpenAI revenue confusion earlier this month, and will it overwhelm the whole AI trade (NVDA, SMH, CRWV, ORCL)? Watch it closely this week.
If this edition helped, hit Like and Subscribe, and ring the bell so you never miss a VietRoadie post.
On behalf of myself and the entire VietRoadie team, happy trading, and good night from beautiful Minnesota.
🔬 Extended Analysis: Going Deeper on This Week's Themes
The main show covers the headlines. This section is for the traders who want to understand why these setups matter and how to think about them, so you can apply the same lens to any chart, any week.
1. Why the Rotation Matters More Than the Headline
One of the easiest mistakes in a market like this is to stare at the index and assume it tells the whole story. SPX and SPY can look stable while the ground underneath is shifting. This week was a textbook example. XLK is roughly 40% of the S&P 500, so when tech sells off hard, the index feels it. But Staples (XLP), Energy (XLE), Healthcare (XLV) and Financials (XLF) absorbed money on the way.
That's the tug-of-war I described in the broadcast. Capital doesn't disappear; it moves. When you see defensive sectors like Staples and Utilities (XLU) catching a bid while the growth-heavy middle of the market falls apart, the market is telling you how participants are positioning. They aren't running for the exits entirely. They're trimming risk and reaching for stability.
The practical takeaway: watch where the money goes, not just where it leaves. A sell-off with a clear rotation destination behaves differently from a sell-off with nowhere to hide. This week had a destination, and that's one reason the index didn't collapse outright. But the dominance of mega-cap tech means the index can only hold up for so long if the largest weights keep falling.
2. Reading the VIX Jump
The VIX rising roughly 30% in a single week, from about 14 to about 19, deserves a closer look. The VIX is derived from the prices of SPX options, and the options that matter most for fear are the out-of-the-money puts. When traders get nervous, they buy those puts for protection, and demand pushes their prices up. The VIX is simply a summary of that demand.
A few things I'd keep in mind:
- A large percentage move from a low base is still a big signal. Going from 14 to 19 doesn't sound dramatic in absolute terms, but it means the cost of protection jumped meaningfully in five trading days.
- It's context, not a crystal ball. A VIX spike can precede a larger move, or it can mean-revert quickly. It's one input, and I treat it as a warning light rather than a trigger.
- It confirms what the charts were already showing. When price breaks down at the same time protection gets expensive, the two signals are agreeing with each other. That's more meaningful than either one alone.
3. How You Approach a Level Matters
This is one of the technical lessons I enjoy teaching most, and SMH gives us a perfect live example. The prior low is 503.63, and we closed the week near 539. Many traders see a prior low and think, "Support. Buy." But a level is only half the story. The other half is how price arrives there.
Here's what I look at:
- Speed: Did price fall in fewer days than it took to rally up? A fast, steep decline is a sign of urgency.
- Range expansion: Are the bars getting larger as price falls? Widening range means sellers are getting more aggressive, not less.
- Contrast: Compare the small, orderly bars during the climb with the big, emotional bars on the way down. That contrast tells you the character of the move has changed.
When price arrives at support with that kind of momentum, I generally don't want to be a buyer into it. I'd rather let the level get tested, see how price reacts, and then decide. Support that's reached gently, with shrinking ranges and fading momentum, is a very different animal from support reached in a panic. The level is the same; the quality of the approach is not.
4. The "Fill the Triangle" Framework
I've mentioned the filling triangle a few times, so let me spell out the idea. When you can draw a triangle on a chart with a flat base at a clear horizontal level, and a sloping edge that has been holding price up, the empty space between them is the "unfilled" area. When the sloping edge breaks, price often travels down to fill that space and reach the base.
On the NDX, the base sits around 28,500. On XLK, the equivalent target is near 180. Both are the same idea applied at different scales, which is why I keep saying everything is interconnected: SMH → XLK → NDX → SPX.
A few reminders on using this framework responsibly:
- It's a map of where price may travel, not a guarantee.
- The edge must actually break. Until it does, the pattern is just a possibility.
- Always define what would prove you wrong. If price reclaims the broken edge, the thesis weakens and you should respect that.
5. From Demand Fear to Financing Fear: The Credit Channel
The most important shift this week wasn't on a price chart. It was in the question the market is asking. For a long time the AI worry was about demand: will anyone actually use all this capacity? Now the question is about money: can the builders afford to keep building?
This matters because it works through the credit channel. CoreWeave (CRWV) and other neo-cloud companies fund their expansion with large amounts of debt. When the yield on that debt climbs to 15%, two things happen. First, new borrowing becomes much more expensive. Second, the market starts asking whether every other borrower in the space deserves the same scrutiny.
That's where the contagion concern comes from. Oracle (ORCL) took on a lot of debt and sold off. Nvidia (NVDA) owns about 10% of CRWV, which ties the chip leader to the neo-cloud story. And the bigger players, Meta (META) and Alphabet (GOOGL), are also borrowing against expected future demand. None of this means a problem is guaranteed. It means the margin for error is smaller than the market was pricing a few weeks ago.
With the 10-year yield (TNX) hovering near 5%, the cost of capital is the quiet pressure behind every one of these stories. High rates punish anyone who has to borrow now and earn later. That's the definition of an AI infrastructure buildout.
6. Oil and Rates: The Backdrop That Won't Go Away
It would be easy to let the AI story crowd out everything else, but crude oil (CL / USO) near $100 and rates near 5% are still the backdrop. Oil keeps feeding inflation concerns, and inflation keeps rates elevated. Thursday's hotter CPI and Friday's PPI reinforced that loop.
On rates, I'm watching for a change in trend, and I haven't seen one yet. A real rollover in TNX would be a meaningful relief for the market. Absent that, the most likely path is sideways balance around 5% before the next leg. Either way, the chart is worth a daily look.
7. Game Plan for Next Week
Here's how I'm framing the week ahead:
- Bias: Technically, the market wants to move lower, led by tech.
- Levels to watch: NDX 28,500, XLK 180, SMH 503.63.
- Catalysts: Housing Starts on Tuesday; Tesla (TSLA) and Meta (META) after the close Wednesday; employment data on Thursday.
- Risk mindset: Volatility is rising, so size positions with that in mind and define your invalidation before you enter.
- The big question: Does the AI financing stress stay contained to the neo-clouds, or does it spread to the broader AI trade?
A Final Thought
Markets like this reward patience and structure. You don't need to predict everything; you need to know your levels, respect the signals, and stay flexible when the story changes. That's what keeping a global perspective, grounded in the levels, is all about.
This content is for educational purposes only and is not financial advice. Trade your own plan and manage your risk.
🔒 Iceberg Model & Key Levels
- Full Key Levels ladder for ES, SPX, and SPY
- IF/THEN road map for the session
- Expected move rails and target confluence
- TradingView and TOS Levels indicators for SPX, ES, and SPY
Paid members also trade it with me live in the Discord, with my screen share and running commentary through the session. 🎙️
Already subscribed to VR Edge or SPX Levels? Sign in with the email address on your subscription to view current SPX levels.
This weekend edition is for educational and informational purposes only and is not financial advice. Market commentary and technical levels are approximate and may change. Trading involves risk, including the loss of principal. Figures and views reflect the supplied weekend edition for the week ending October 16, 2026.
Let’s work together
Ready to join VietRoadie’s team?
Tell me about your interest – I’d love to customize a product / subscription plan that fits your needs.